Help and Tutorial
GENERAL
Gene ORGANizer is a tool designed to allow users to analyze the relationships between genes and organs. The tool contains annotations for over 7,000 genes, which are linked to ~150 body parts, divided into 4 levels of hierarchy: organs (e.g., stomach), systems (e.g., digestive), regions (e.g., abdomen) and germ layers (e.g., endoderm). Users can either Browse a specific gene to see which body parts the gene affects, or enter a list of genes in ORGANize to find out what body parts are enriched or depleted within the list. Results are displayed in an interactive user-friendly body map visualization and in a summary table. Both may be downloaded and used in your publications (please see Citing us).
THE DATABASE
Gene ORGANizer contains annotations for over 7,000 genes. Genes were annotated based on human, mouse and rat phenotypes observed either in diseases or in normal inter-individual variation (e.g., height). Gene-disease and gene-phenotype associations were downloaded from the highly curated Human Phenotype Ontology (HPO) and DisGeNET tools. We translated over 100,000 of these gene-disease and gene-phenotype associations into gene-body part associations. We divided the body parts into four hierarchies: organs (126 in total), systems (12 in total), regions (6 in total) and germ layers (3 in total), to which genes were linked. For example, one of the symptoms caused by mutations in the HOXA2 gene is microtia, i.e., underdevelopment of the outer ear (OMIM ID: 612290). We have used this association to link HOXA2 to the following organs and sub-organs: the outer ear, the ear and the head, as well as to the integumentary system, the head and neck region and the ectoderm germ layer.Annotations were divided into two categories - confident and tentative - based on their level of curation. Confident represents annotations that were derived from both HPO and DisGeNET. Tentative refers to annotations that were derived from only one of the DBs and are usually based on phenotypes that were observed in non-human organisms (i.e., mouse or rat).Annotations are also categorized based on the frequency of the observed phenotype. Typical represents phenotypes that were observed in >50% of patients with a specific disease. Non-typical represents rarer phenotypes.For a full description of the annotation process, please see our publication:
USING THE TOOL
BROWSE
Browse allows users to enter their gene of interest and see all of the organs, systems, regions and germ layers that the gene affects. Results are displayed in an interactive user-friendly body heat map and in a table. Both could be downloaded and freely used in your publication (see Citing us).
To start browsing, please go to Browse page and enter a gene ID:

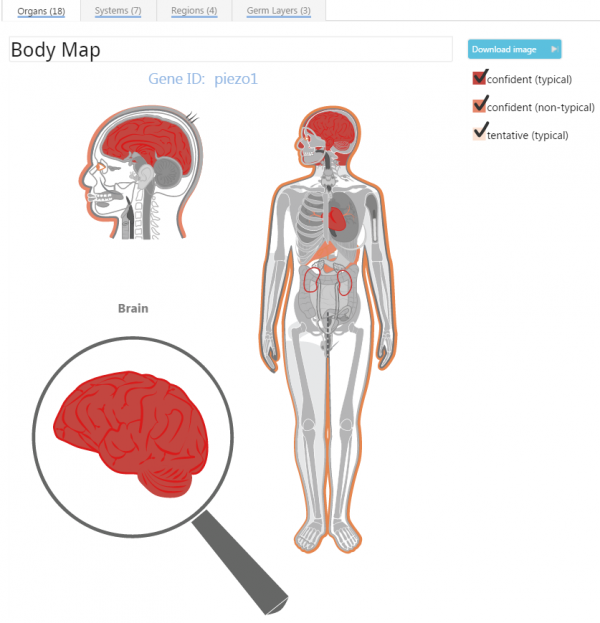
The results will be displayed in interactive maps. There are three maps that give various hierarchical classifications: Organs, Body systems, and Body regions. A fourth classification to Germ layers visualizes the associations using a table.

Hovering over a body part will render an exploded view of it in the magnifying glass. The colors in the body map represent the different levels of curation and frequency of each gene to body part association. Users may choose to restrict the view by checking or unchecking the annotation sources in the top right. Results are also given in a table below the plot, which contains all annotations including some body parts that could not be displayed in the heat map (e.g., blood):

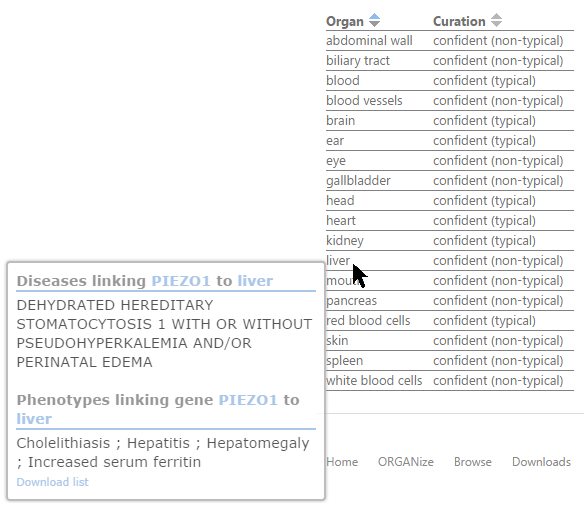
Hovering over an organ in the table, you will get a popup of the diseases and phenotypes that led to the association of the gene to this specific organ:

It is advised to navigate to all four tabs that appear above the image. The number of associated body parts is given in parentheses next to each tab's label:

ORGANize
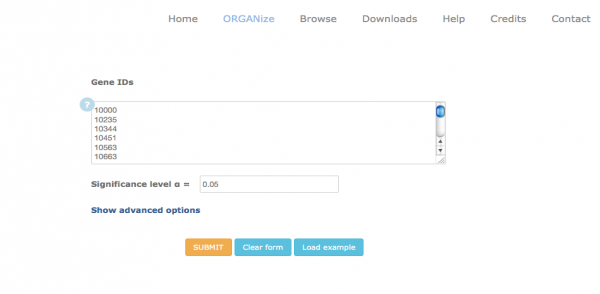
As nice as the Browse option is, ORGANize is where the real power of Gene ORGANizer lies. In ORGANize, a user may enter a list of genes of interest and Gene ORGANizer will compute which body parts are significantly enriched or depleted within this gene list, as compared to the genomic background. By simply entering genes in the main text field:

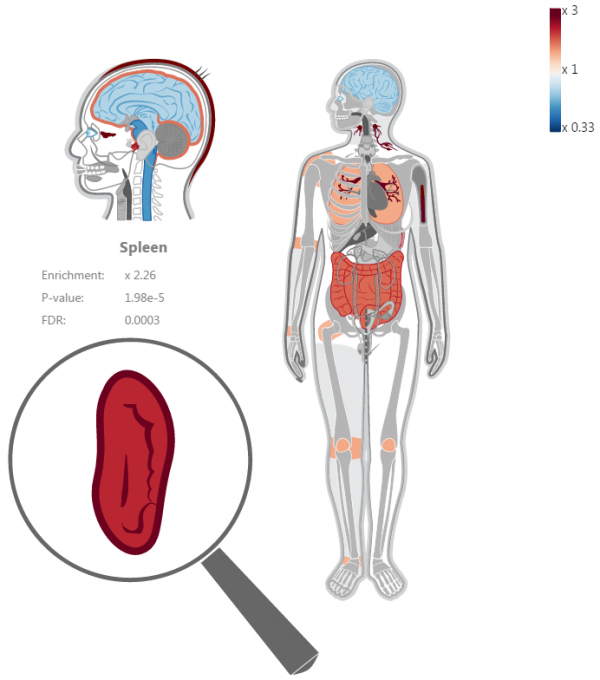
a heat map will be rendered and a table representing the level of enrichment/depletion in each body part will appear below it:

Only body parts that pass a user-predetermined significance level (default: α=0.05) are colored from cold (blue, depleted) to hot (red, enriched). Hovering over a body part will zoom in on it to show the exact level of enrichment, the P-value and the FDR or Bonferroni corrected P-value, along with the zoomed image inside the magnifier glass.
Please do not forget to pay a visit to all four classification tabs:

The Results table
While the heat map is designed to provide an interactive and visual examination of the results, the table provides users with more detailed information. The table also includes body parts that do not appear in the heat map, i.e., body parts that are too small (e.g., sweat gland) or are ubiquitous (e.g., blood). The red and blue arrows mark body parts that passed the significance level entered by the user (α). You can also hover over any of the body parts in the table to get a description of which genes from the ones you entered are linked to that body part:

The Download list link will download these genes into Excel. Alternatively, clicking on any of the genes in the popup list will open a Browse window of that gene to visualize what other body parts are associated with it.
Advanced options
When running the ORGANize query, users can choose between a few additional options:
Background: In some cases, the user's gene list is inherently biased and thus, it is recommended to enter your own background, rather than use the default genomic background. For example, in cases where differentially methylated genes were identified using a methylation array, it is recommended to enter a background of the genes that are covered by probes on the array. It is important to note that our database is gene-based, meaning that each record is a specific gene, rather than a transcript. Therefore, if you enter a list of transcript IDs and you are interested in treating different transcripts that come from the same gene as separate records, then choose the option of "transcript-based" under advanced options → analysis type. Also, in this case, you should consider entering your own background, which should reflect the abundance of the different transcripts. Preferably, the background you entered should be in the same ID format as the query.
Level of curation: Choose between confident and confident+tentative to define the scope of annotation. See The database for more details.
Frequency of phenotypes: Choose between typical and typical+non-typical to define the frequency of the observed phenotypes. See The database for more details.
Multiple comparisons correction: Choose between FDR and Bonferroni.
Remove duplicates (count two identical genes as one hit): uncheck this box when you want Gene ORGANizer to treat repetitions of the same gene ID as multiple hits. For example, if your gene list was produced by looking for genes that bear SNPs in their promoter region, then you might want to count two SNPs in the same gene promoter as two hits and analyze the enrichment of body parts accordingly. Consider entering your own background in cases where one appearance per gene does not reflect the true probability of appearance for each gene.
Type of analysis: Gene ORGANizer can treat different transcripts that come from the same gene as one record (i.e., gene-based), or as separate records (i.e., transcript-based). If you choose the option of transcript-based, then consider entering your own background, which should contain the different transcripts from which your list stems. This is because the default background of Gene ORGANizer is gene-based, meaning that each record is a gene. Preferably, the background you entered should be in the same ID format as the query.
Color scaling: Gene ORGANizer can color the ORGANize heatmap using two options. The first option (fixed) colors body parts using a fixed color scale that ranges between x0.5 (blue) to x2 (red). Body parts with enrichment levels above x2 will be colored with the maximum (x2-red) color, and body parts with depletion levels below x0.5 will be colored with the minimum (x0.5-blue) color. The second option (auto-scale to range) uses a color scale that is dynamic and is defined by the minimum and maximum observed depletion/enrichment levels in your results. For example, if the highest level of observed enrichment is x4.5 and the lowest is x0.6, then the color scale range would span from x0.6 (blue) to x4.5 (red). We suggest using this option.
FAQs
What can I do with Gene ORGANizer?
Gene ORGANizer was developed to address one of the biggest challenges in genomics: linking genes to the body parts they affect. This tool implements two platforms: Browse and ORGANize. Browse is used to analyze a specific gene and see what body parts are affected by it. ORGANize is used for analyses of gene lists. It reports the body parts that are enriched/depleted within the list. See our publication for more details:
I entered a gene in Browse, but got no results, why is that?
Gene ORGANizer currently contains annotations for ~7,000 genes. This is the number of genes that are linked to known phenotypes in the HPO and DisGeNET databases. We are constantly working on expanding our database. In some cases, there are genes that are linked to a known phenotype, but this phenotype cannot be translated to specific body parts (e.g., "failure to thrive"). In such cases, the gene will not appear in our database.
I entered a list of genes in ORGANize, but got no significant results, why is that?
ORGANize returns significant results only if the list you entered is enriched or depleted for specific body parts. Naturally, this is not always the case. However, if you didn't get significant results using the default settings, try extending the analysis by clicking `advanced options' and choosing typical+non-typical associations or tentative annotations.
How were the gene to body part annotations created?
Please see The database section
In what way is this tool different from expression-based tools?
Ohh… in many ways. Expression analyses are important and provide precious information, but they do not tell the whole story:
a. The repertoire of expression datasets is limited, with a strong bias towards some organs and tissues (e.g., brain, blood and skin), whereas many other body parts are rare or completely absent (e.g., bone, face, larynx, urethra, teeth, fingers, spinal cord and many more). Also, samples used for expression analyses are obtained from specific developmental stages, often post-mortem, and from specific parts of the organ, thus missing the entire temporal and structural variation within the organ. The fact that Gene ORGANizer is based on phenotypes means that it provides annotations for dozens of body parts that are absent in expression databases, and it also includes annotations that arise from narrow developmental windows and specific sub-regions in different organs.
b. Expression analyses generally focus on lower hierarchies such as specific cell types or tissues (e.g., hepatocytes, T-cells), whereas higher hierarchies, such as systems (e.g., digestive system) and anatomical regions (e.g., abdomen) are rarely analyzed.
c. Expression does not equal function, let alone an observable phenotype. There are various reasons why a gene that is expressed in a tissue would not necessarily affect its phenotype, or alternatively, why a gene for which no expression was detected in a tissue would still affect its phenotype. Some of the main reasons are: i) Post-transcriptional modifications and degradation of the RNA. ii) Some genes are expressed at sub-threshold levels (and are therefore considered unexpressed), but have considerable phenotypic effects. iii) The activity of a gene is not necessarily limited to the tissue in which it is expressed (for example, expression of a gene in the endocrine system would often have phenotypic consequences in other tissues).
Therefore, in order to get a complete genetic picture, which includes both the molecular function and the phenotypic effect of genes, we suggest using both platforms – expression-based tools and phenotype-based tools.
What species can I analyze in Gene ORGANizer?
The tool was built based on human phenotype annotations. However, there's no reason not to use it for other close species as well. Simply convert your list of IDs to human IDs (or use gene symbols, which are largely shared between species).
What are the confident and tentative curation levels?
Please see The database section.
CITING US
To cite Gene ORGANizer, please use the reference below:
David Gokhman, Guy Kelman, Adir Amartely, Guy Gershon, Shira Tsur, Liran Carmel; Gene ORGANizer: linking genes to the organs they affect. Nucleic Acids Res 2017 gkx302. doi: 10.1093/nar/gkx302
For a full list of credits, please visit the credits page.
Please contact us for further questions or queries.

